
Case study: how we increased SEO sales by 24% for an e-commerce store
For years, Neadoo Digital has been optimizing e-commerce stores for search engines in international markets. In this case study, we describe our collaboration with an online store selling heating system components in the UK. The store's customers are primarily installers and contractors - people who are not looking for inspiration, but for a specific device with a specific parameter.
This text differs from most SEO case studies in one way. There is no headline about organic traffic growth. Traffic in this project was not the goal, but a tool, and we measured our success by sales. At the peak of 2026, search engine sales grew by 24% year-over-year and accounted for three-quarters of the store's total revenue.
Strategy: SEO measured by sales, not traffic
The store entered 2026 facing declines. Total business revenue in the first quarter was down 29% year-over-year, and by more than 35% in the second quarter. Part of this decline had a simple reason: in 2026, the store was no longer running paid campaigns, which a year earlier had accounted for over £8,000 in revenue in a single quarter. In such an environment, the promise of "we will increase traffic" has no value, because the owner doesn't need visits; they need orders.
So we set the strategy in the opposite direction of the standard approach. Instead of looking for high-volume keywords and building content around them to attract as many visits as possible, we started with the question of which queries in this industry actually lead to a purchase. The answer in technical e-commerce is quite straightforward: the person buying is the one who searches for the component name along with a technical parameter, most often the device's power rating. They have a blueprint on their desk and are selecting equipment for it.
Such queries have low search volume, a dozen or a few dozen searches per month. In any keyword research tool, they look unworthy of attention. However, the competition for them is significantly lower because most stores in this industry do not have dedicated pages for them, and the purchase intent is almost 100%.
Keyword and search intent analysis
The starting point was a comprehensive keyword analysis divided not by volume, but by intent. For each query, we checked what the searcher was looking for: did they want to learn, compare, or buy? Based on this, we categorized queries into transactional, supporting, and informational keywords, each playing a completely different role in the strategy.
The analysis also revealed a fundamental issue with the website. Transactional queries containing a technical parameter led to a single, generic category listing, which everyone landed on regardless of which variant they were looking for. A user with a specific requirement ended up on a page with dozens of products and had to dig through them manually. Google, on the other hand, had no reason to treat that listing as a precise answer to a specific query, so it ranked it far down in the search results.
How this helped: we obtained a list of queries that required dedicated landing pages, ranked not by volume, but by sales potential. All subsequent work, from site structure to links, followed this priority.
Website structure and navigation
We restructured the category layout so that every real purchase query had its own dedicated landing page. Instead of a single listing gathering all product variants, we created a hierarchy with separate subpages for individual parameters.
At the same time, we changed the navigation. The new subpages had to be accessible from the menu, because a page that receives no links from key areas of the site is considered second-rate by Google, even if it has good content.
How this helped: a user entering a query with a specific parameter lands on a page focused precisely on that parameter, rather than a generic list. This cuts the path to checkout by several clicks, and in search engines, it provides a page that answers the query more accurately than competing listings. Menu linking passed the necessary authority to the new subpages to push them onto the first page of search results.
Let's check your website's potential
Share your website and email - we'll get back to you with a real analysis, no strings attached.
Content-free categories
There were many categories on the site that consisted solely of a product list pulled from a feed. Not a single sentence explaining how the variants differed, how to select the right parameter for an installation, or what would happen if the wrong choice was made.
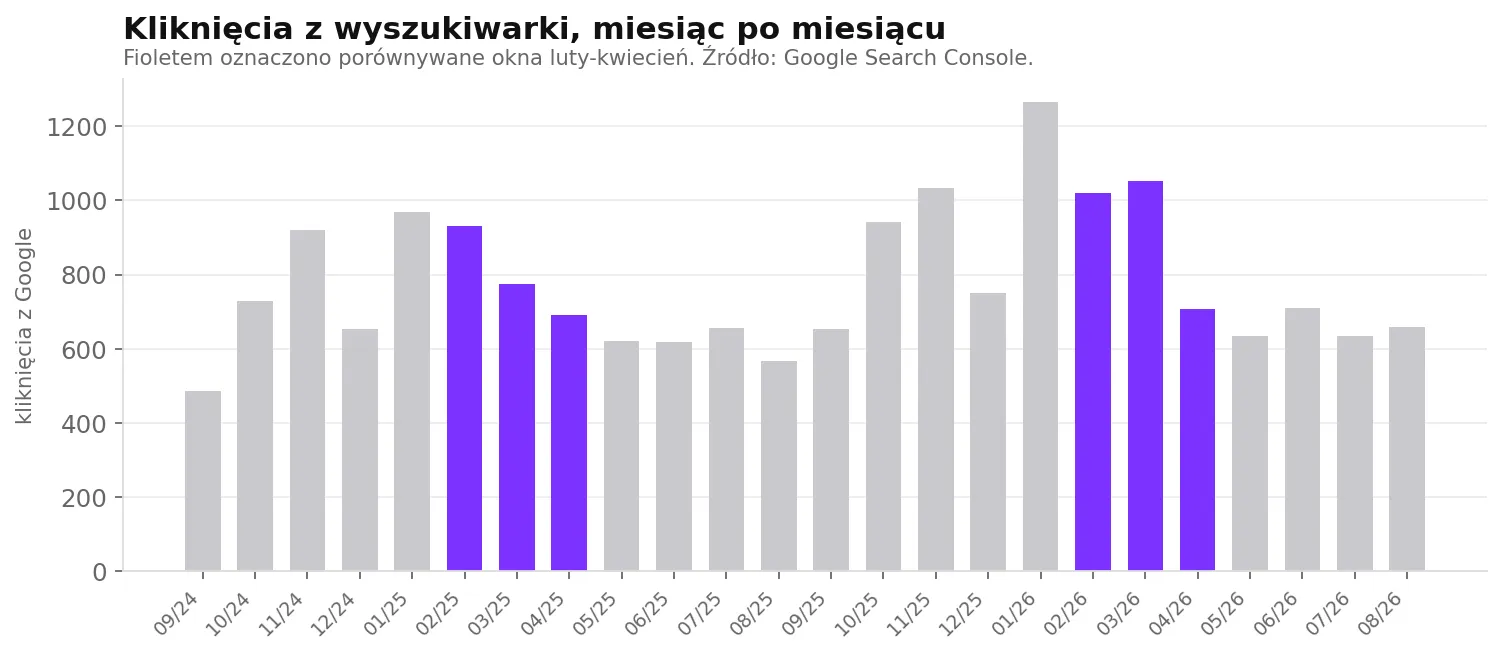
Such pages show a characteristic pattern in Search Console: impressions are there, but clicks are not. In March 2025, the store recorded 138,000 monthly impressions with only 775 clicks - a CTR of 0.56%. Google saw these pages, considered them partially relevant to the queries, and displayed them on page four of the search results, where nobody looks.
How this helped: a category with impressions and no clicks is the most cost-effective asset a store has on hand. You don't have to build it from scratch because Google already knows it and has initially evaluated it. You just need to give Google a reason to promote it. That is why we started filling in content on these pages rather than on new ones.
Content: copy designed for purchase decisions
Category content wasn't meant to describe individual products, as that is the job of the product page. It was meant to answer the questions an installer asks before buying: which variant suits which application, how to calculate the required parameter, what the consequences of a sizing error are, and what else is needed for installation.
Separately, we created product-adjacent content addressing informational queries: what a given component is, how it works, and what an installation diagram looks like. Let's be blunt, because agency case studies rarely admit this: this content does not sell. Someone searching "how X works" is not buying yet.
How this helped: informational content delivered two things. It built visibility in a topic where the store previously had virtually no presence, and it served as a source of internal linking to transactional categories. A user who came looking for an explanation was given a clear path to a product page tailored to their specific use case. This bridges the gap between the question and the order, which a plain product listing cannot do on its own.
Link building
We directed links to priority categories, not to the homepage. The homepage already had the strongest link profile across the entire site, and it was the transactional subpages that needed to grow. We built the link profile at a natural pace, selectively targeting areas where a category had sales potential but lacked the authority to reach the first page of results.
How this helped: categories that hovered on the second page of results after content optimization only needed authority to jump higher. Links pointing to the homepage would not have transferred that impact to the specific subpages effectively enough.
Results Achieved
a) Organic sales growth against declining store-wide sales
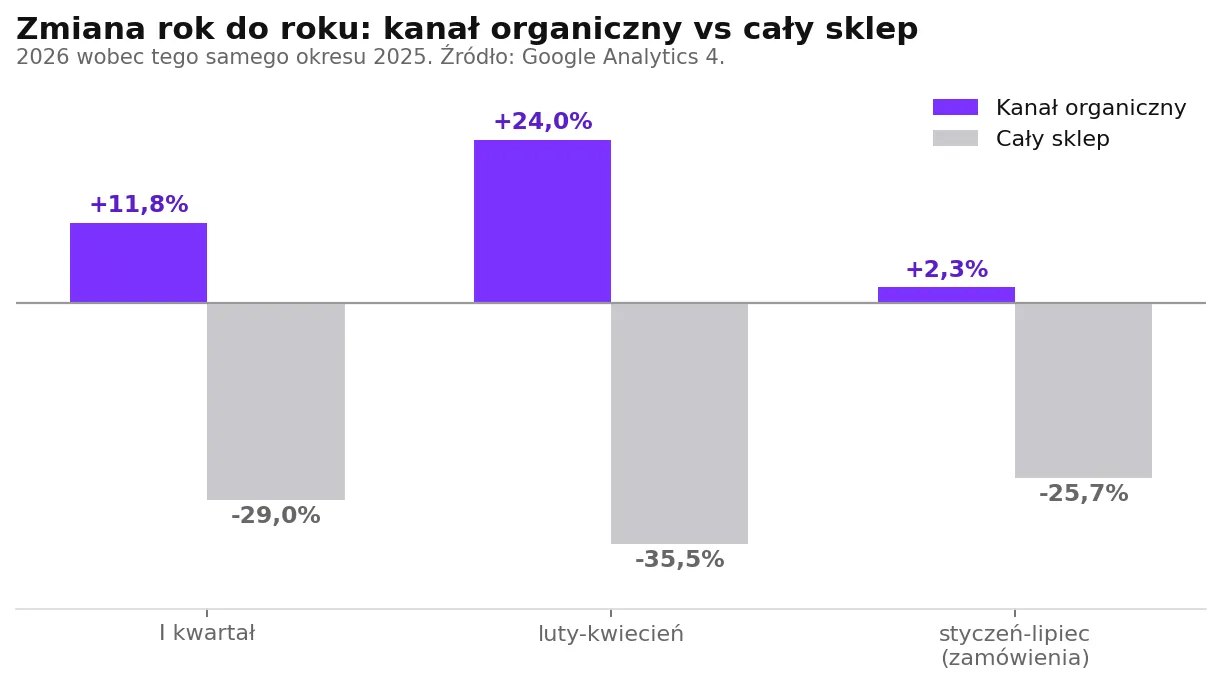
In two of the three windows, both revenue and organic orders are growing. In the longest window, the number of orders is growing, while revenue drops slightly. The entire store declines in every single one of them.
| Window | Organic orders | Organic revenue | Entire store |
|---|---|---|---|
| Q1 2026 vs 2025 | 58 → 69 (+19%) | £17,624 → £19,698 (+11.8%) | revenue -29% |
| February-April 2026 vs 2025 | 49 → 64 (+31%) | £14,231 → £17,638 (+24%) | revenue -35.5% |
| January-July 2026 vs 2025 | 132 → 135 (+2.3%) | £39,734 → £36,262 (-8.7%) | orders -25.7% |
In the longest window, from January to July, search revenue was 8.7% lower than the year before, with the number of orders up by 2.3%. The channel therefore held its ground, while the store as a whole lost a quarter of its orders during this period. We show this window precisely because it is the least favorable to us.
From February to May 2026, four months in a row, search revenue was higher than the previous year. In each of those months, the entire store sold less.
It is worth showing what caused this store-wide decline, because without that context, the numbers can be spun either way.
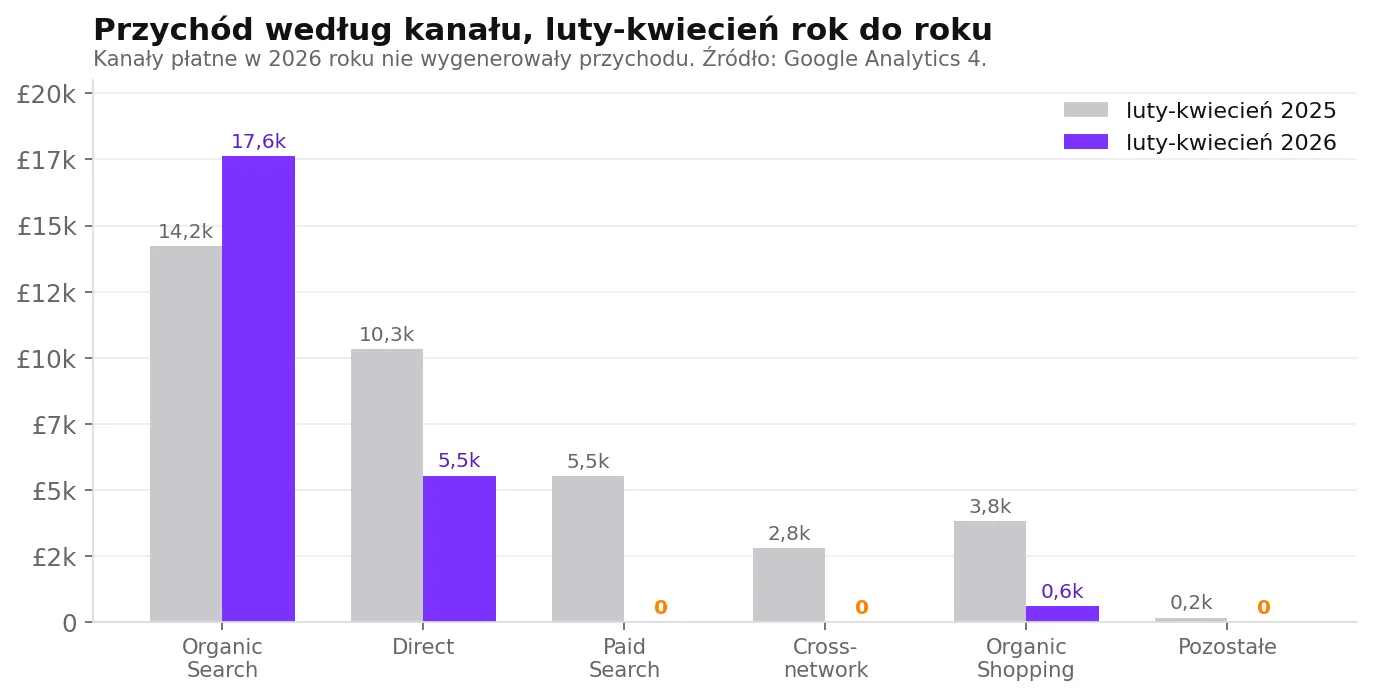
In 2026, paid channels - namely Paid Search and Cross-network - did not generate a single pound in revenue. The year before, they brought in £8,339, which accounts for nearly two-thirds of the store's entire drop. So this is not a story about a market collapse, and we will not tell it that way.
A fair comparison is one that calculates both on the same basis. After excluding paid channels from both years: store sales dropped by 17%, while search sales grew by 24%. In the same quarter, for the same store, on the same terms.
The share of search alone in non-paid channel revenue grew in the February-April window from 50% to 74%.
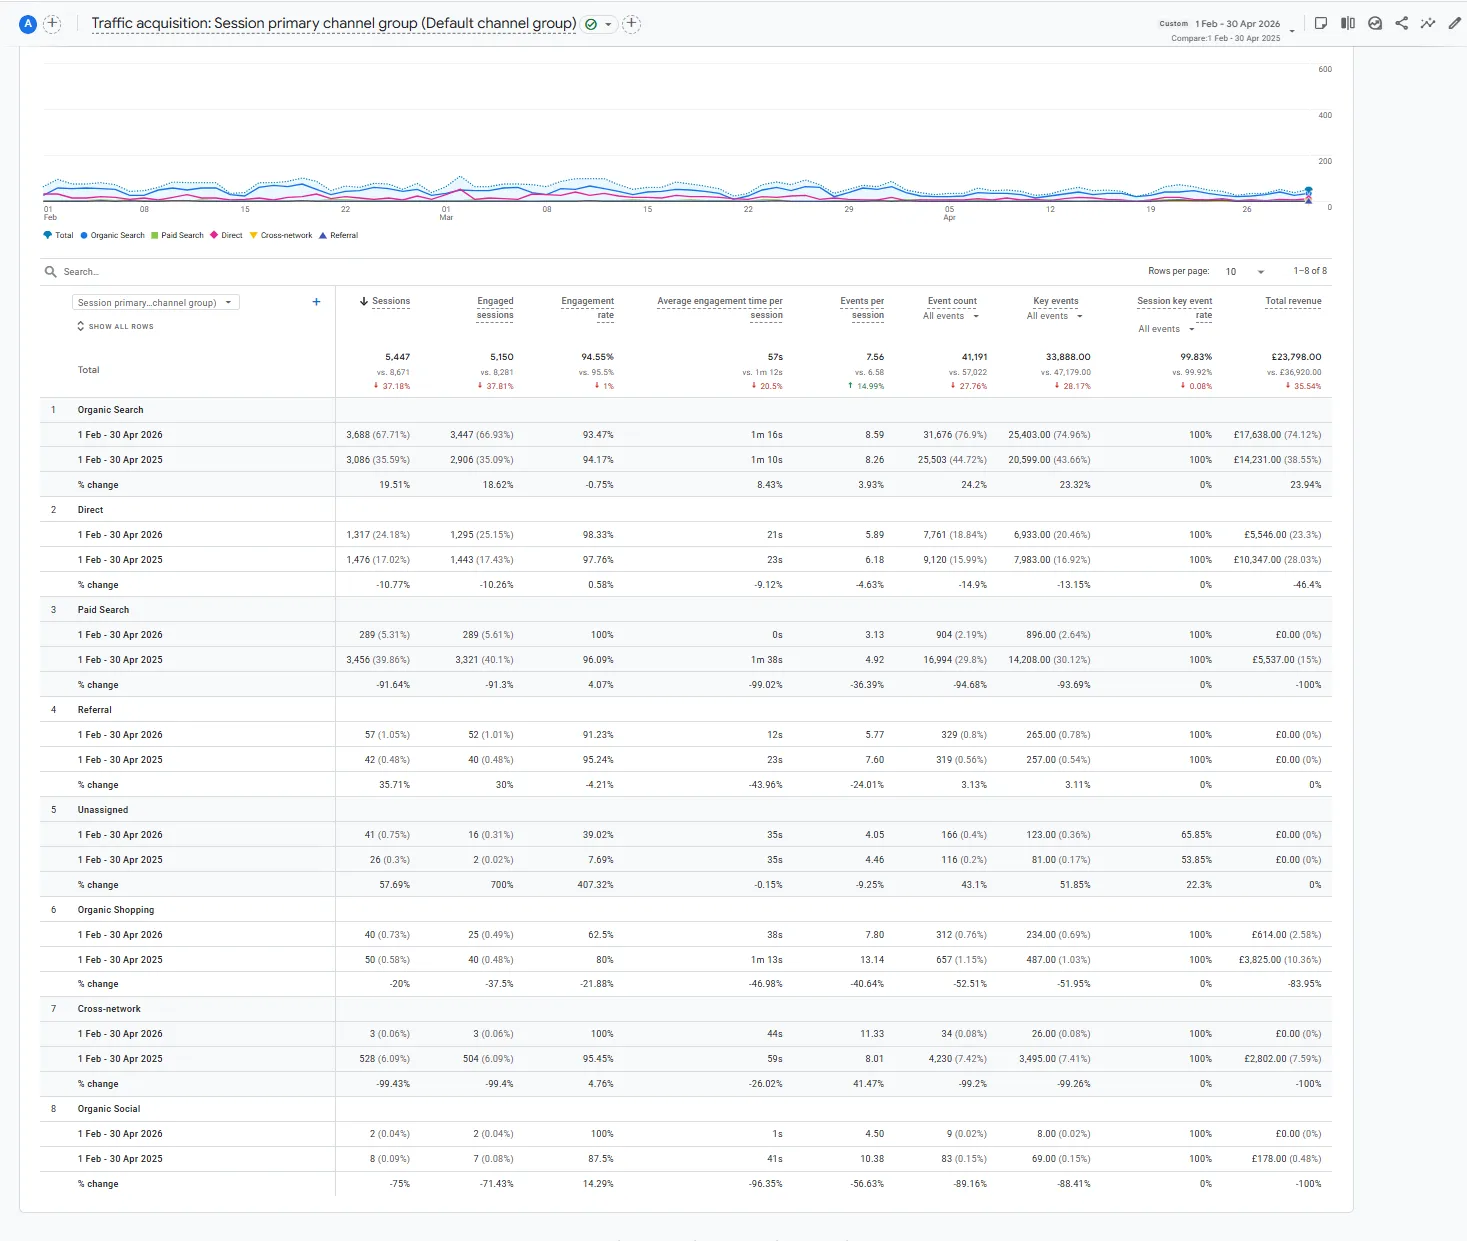
The most important number in this breakdown is not a growth percentage. Across the entire available period, from January to July, search's share of the store's revenue increased from 53% to 71%. A store that once split its sales roughly fifty-fifty between search and all other channels now gets seven out of every ten pounds from search.
b) Visibility: average position from 38.4 to 13.1
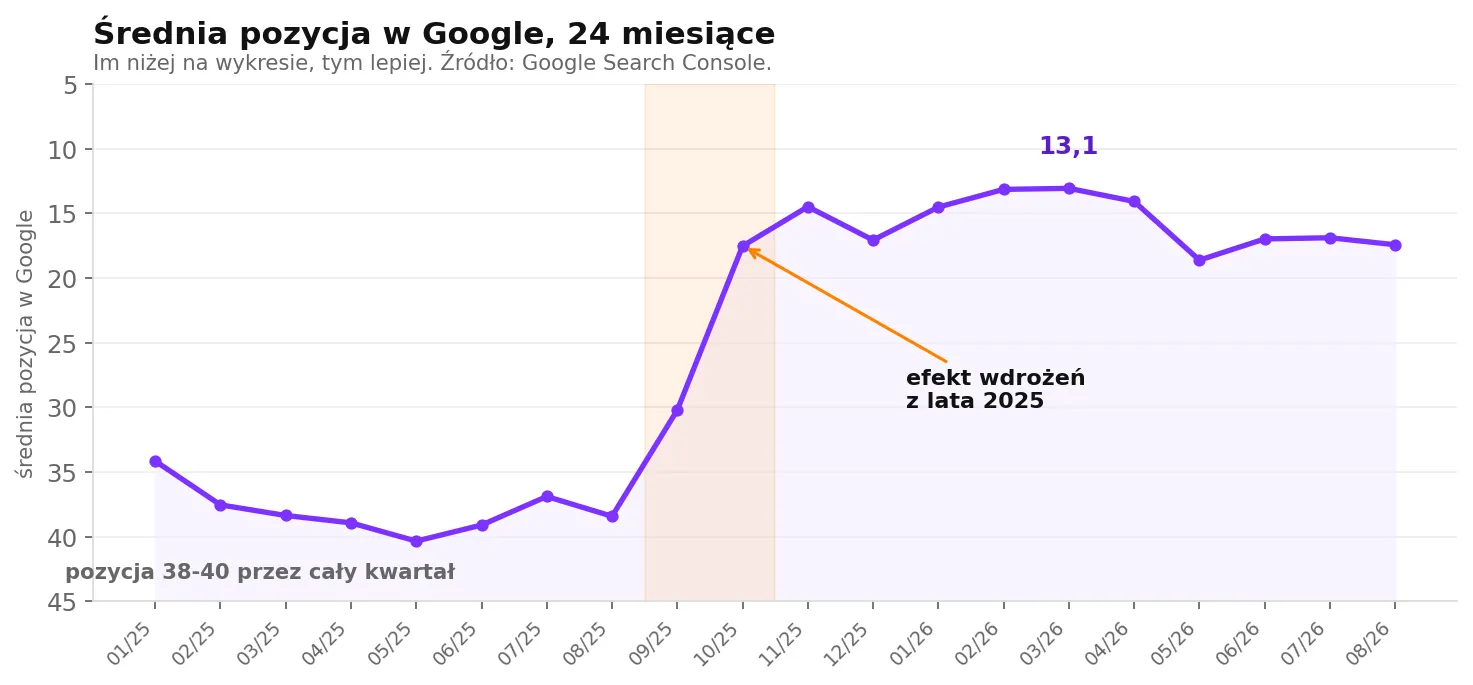
| Metric | March 2025 | March 2026 |
|---|---|---|
| Average position | 38.4 | 13.1 |
| Impressions | 138,342 | 170,662 |
| Clicks | 775 | 1,052 |
Clicks increased by 36% with impressions up by 23%. So it was not just the number of appearances in results that grew, but also the efficiency with which they turned into site visits.
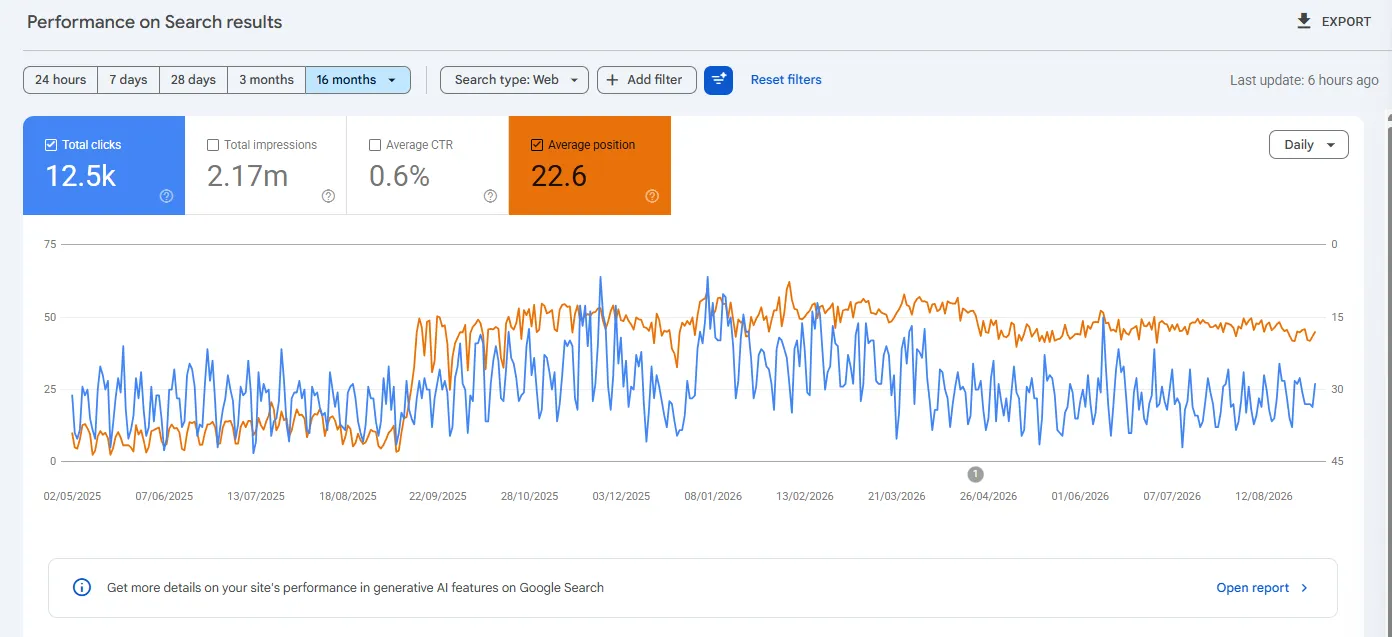
c) Commercial keywords
Search queries reveal the exact pattern that the strategy intended. The primary category keyword: quarterly impressions went from 6.4 thousand to 12 thousand. Variations of this keyword that include a device power rating - the ones installers use when making a purchase: from 13 to 45 clicks per quarter, compared to a prior level that was near zero for most of them.
Separately, queries for the store name itself increased by 71%. Some users who landed on the site via a technical query returned later by searching directly for the brand name.
Where these numbers come from
Revenue and orders: Google Analytics 4, Organic Search channel, purchase revenue and transaction count. Visibility: Google Search Console. No modeling, no multi-channel attribution, no adjustments.
We compare a quarter to the same quarter of the previous year, not month-over-month, because the store is subject to seasonality and month-to-month comparisons are meaningless. We show three different windows, including the longest one available, to demonstrate that the results do not depend on cherry-picked dates.
What this means if you run a store
Categories without content are the lowest-hanging fruit in your inventory. If a page gets impressions and zero clicks, Google already knows about it. You do not have to start from scratch; you just need to give it a reason to rank higher.
Keywords with parameters sell better than high-volume keywords. A broad category name has a thousand searches, and everyone is competing for it. A name with a specific parameter has forty, and it is typed by someone who is actively making a buying decision. The second query is worth more, even if it looks less impressive in SEO tools.
The organic search channel does not shut off when your budget does. When the market slows down, the first thing cut is paid campaigns. Organic search traffic stays - provided you built it beforehand.
TL;DR - Summary in a Nutshell
- Environment: overall store sales dropped by 29-35% year-over-year, largely because paid channels were no longer active in 2026. Excluding them from both years, the store's decline is 17%.
- Result: organic search sales grew during the same period. +31% in orders and +24% in revenue in the February-April 2026 window.
- Sustainability: four consecutive months of organic revenue growth despite the overall store's decline.
- Channel share: from January to July, organic search accounted for 71% of store revenue, up from 53% previously.
- Visibility: average position improved from 38.4 to 13.1, clicks +36%.
- Foundation of the result: website structure rebuilt for queries with technical parameters, content added to categories that previously had none, and links directed to sales landing pages instead of the homepage.
We Will Do the Same for Your Store
If you run a store and do not know how much of your sales actually come from search engines, that is the first number worth finding out. The second is the number of categories that have impressions in Google and zero clicks. We will check both in a free audit.