
Case study: how we increased SEO sales by 41% during peak season

Neadoo Digital optimizes e-commerce stores, including those that make their entire annual revenue in just a few months. In this case study, we describe our collaboration with a seasonal store featuring two separate offerings - winter and summer - where sales are concentrated between November and March. Outside of this period, sales drop to a small fraction of the peak.
The client had never run Google Ads campaigns. All online revenue relies on search engines and direct traffic, which makes this project a fairly clean experiment: everything visible in the data is the result of working on organic visibility.
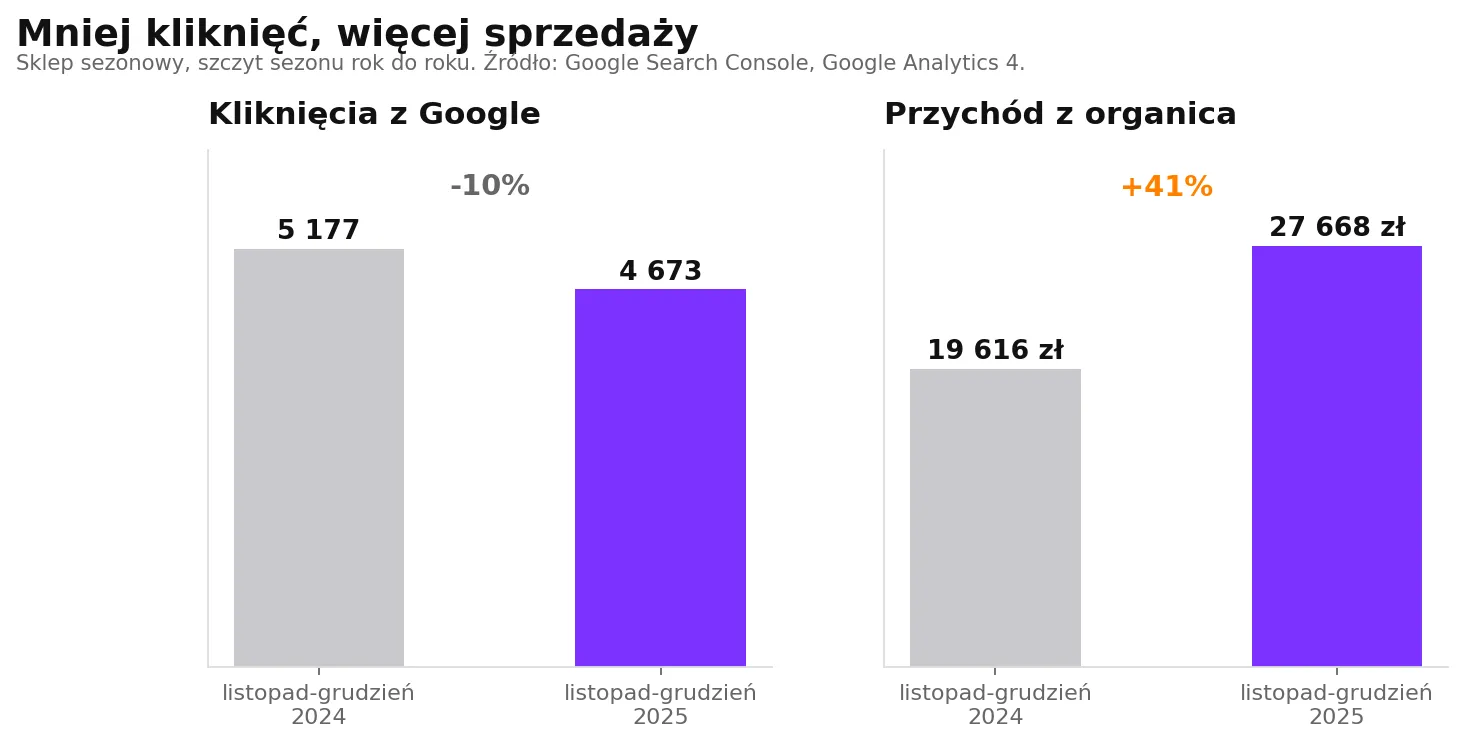
The result we will start with is unusual. During the 2025 peak season, the store received fewer clicks from Google than the year before and generated 41% more in sales.
Strategy: winning the season in the off-season
In a seasonal store, the schedule of work is more critical than in regular e-commerce because a timing mistake cannot be corrected within that year.
Content and links need two to four months to climb into ranking positions and build search engine trust. This means that a page intended to drive sales in November must be ready and indexed in September. If it goes live in November, it will only yield results in the following season - meaning a year later. A client who calls in October asking if anything can still be done for the upcoming season is calling a quarter too late.
That is why we started working on winter categories in the middle of summer, during the dead sales period. Exactly when nothing is happening in the data and it is easiest to assume that nothing needs to be done.
The second premise of the strategy involved what we defined as success. Not traffic, but sales. This distinction proved crucial in this project, as both numbers moved in opposite directions.
Holistic analysis of seasonal categories
We started with a review of all winter categories at once, rather than one by one. In a seasonal store, categories compete with each other for the same queries more often than in broad e-commerce because the product range is narrow and closely related in topic. Two similar categories can cannibalize each other's visibility for the same keyword, preventing either from ranking high.
The analysis answered two questions: which categories have real sales potential during the season, and which query should lead to which category.
How this helped: we gained a keyword-to-page mapping, ensuring that every query had a single destination on the site. Without this, adding more content would have only amplified cannibalization - a situation where multiple subpages fight for the same search term and weaken each other.
Keyword and search intent analysis
The second step was the most important for the sales outcome. For every keyword, we verified what the person typing it actually wanted: to learn, to compare, or to buy. Then, we matched the page type and its on-page content accordingly.
The analysis revealed a disconnect between what the store was ranking for and what its customers were actually searching for. Some queries with clear buying intent were leading to informational content. A user ready to buy was reading an explanation instead of seeing a product, and bouncing. The reverse happened as well: comparison queries landed on product listings without any guidance to help make a choice.
How this helped: this is where the effect mentioned at the beginning originated. We stopped chasing clicks that did not lead to a purchase and started fighting for the ones that do. Traffic dropped, revenue grew. A click from an informational query and a click from a transactional query count identically in Search Console. In the shopping cart, they do not.
Let's check your website's potential
Share your website and email - we'll get back to you with a real analysis, no strings attached.
Content plan and pre-season content deployment
Based on the analysis, a content plan was created and mapped to specific winter categories, with deadlines set well ahead of the start of the season. The content was written for its assigned keywords and tailored to the user's decision stage. A category with transactional queries received content designed to shorten the path to product selection, rather than an extensive guide.
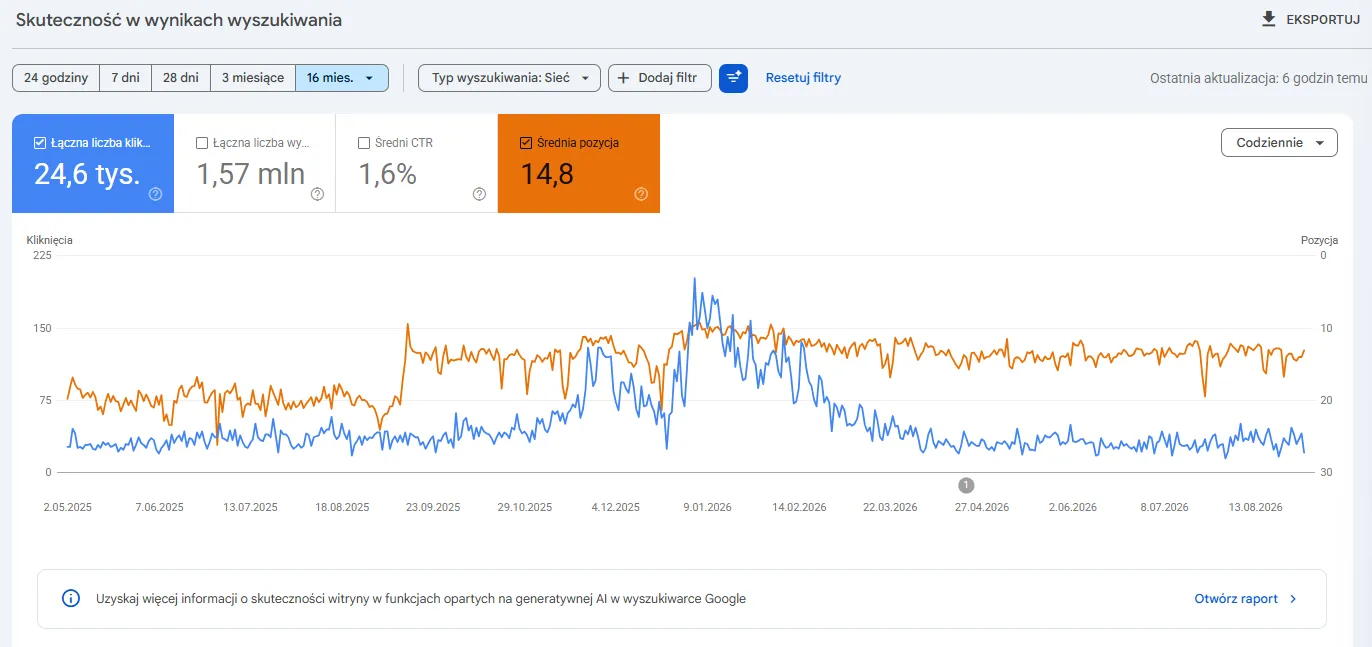
How this helped: the implementations were rolled out several months before peak sales, so the pages had enough time to rank by November. This is visible in the visibility data. Average position: 19.8 in August, 17.0 in September, 14.3 in October, 13.4 in November. The graph started moving three months before the first dollar from the season came in.
Link building
We directed backlinks specifically based on the needs identified in the analysis. They went where a category had sales potential and strong content, but lacked the authority to break onto the first page of search results. We did not spread them evenly across the website.
How this helped: with a narrow catalog, the number of pages that actually drive sales is limited. Concentrating the link profile on a few key categories delivered a greater impact than dispersing the same budget across the entire site.
Summer offering
We repeated the exact same process - from holistic analysis and intent mapping to content deployment - for the summer offering, shifted by six months on the calendar. A seasonal store with two product ranges has the advantage of never having a dead quarter for SEO. While one offering is driving sales, work is underway on the other.
Results Achieved
a) Fewer Clicks, Higher Sales
| Metric | November-December 2024 | November-December 2025 |
|---|---|---|
| Clicks from Google | 5,177 | 4,673 (-10%) |
| Organic revenue | 19,616 PLN | 27,668 PLN (+41%) |
| Organic orders | 28 | 38 (+36%) |
| Total store revenue | 26,406 PLN | 29,456 PLN (+12%) |
It is worth listing what this growth cannot be attributed to.
Not to general market trends, because the entire store grew by 12% in the same window, while the search channel grew by 41% - more than three times faster. Not to advertising, because the client did not run any Google Ads campaigns. Not to traffic volume, because there were fewer clicks. Not to price increases, because the average order value was 700 PLN in 2024 and 728 PLN in 2025 - virtually unchanged. The revenue growth came directly from the number of orders.
The same picture is visible in Google Analytics, the tool that tracks sales. Sessions from the organic channel dropped from 6,854 to 6,547, down 4.5%, while revenue from those sessions grew by 41%.
b) Organic Channel Revenue Month by Month
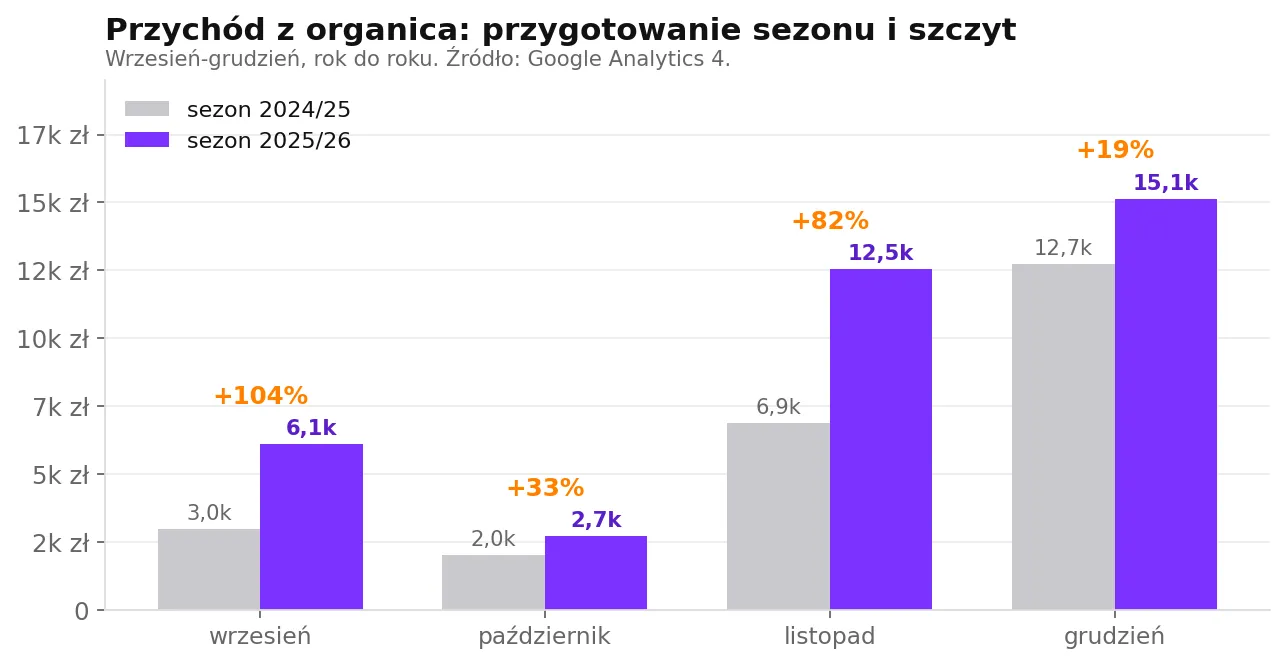
Four months that decide the winter season: two for preparation and two for sales. Each generated more than the previous year, totaling 36,475 PLN compared to 24,644 PLN - a 48% increase.
These figures illustrate the timeline described at the beginning of this article. September and October are not the season yet; sales are low, and no one evaluates SEO effectiveness during these months. However, this is when new content secures its rankings. The result of this work only becomes visible in November and December, when users ready to buy encounter it.
That is why, for a seasonal store, comparing one month to the previous month makes no sense. The difference between December and October is not an SEO effect - it is a calendar effect. What matters is how much the store earned during its peak, and how that figure compares to the peak from the year before.

c) Share of Search in Sales
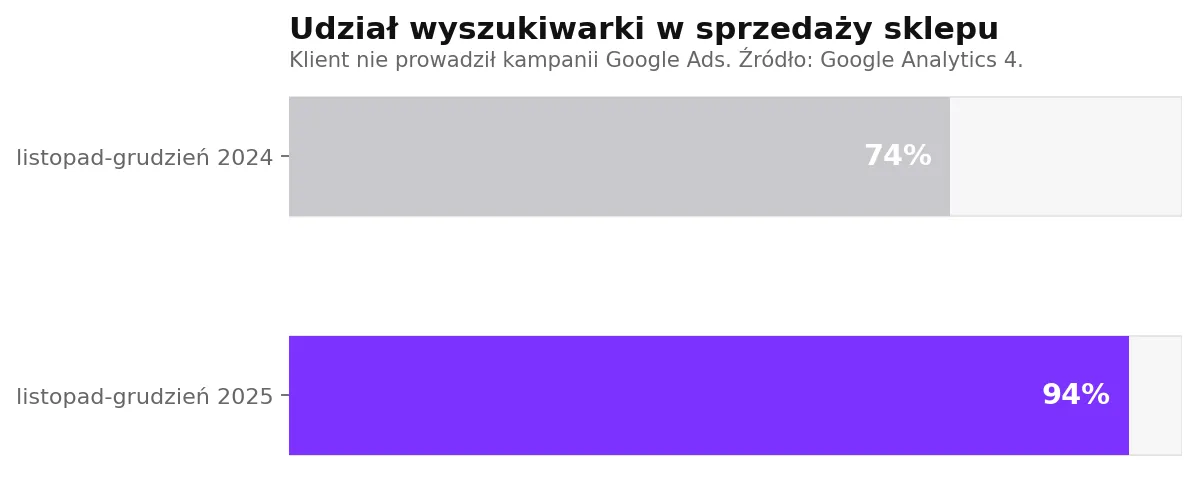
The number that reveals the most about this store: 94% of sales during the peak 2025 season came from search, compared to 74% a year earlier. Without spending a single zloty on Google ads.
It is worth noting that this jump in share has two drivers. The first is the 41% increase in sales from search. The second is a drop in sales from direct visits, from 6,523 PLN down to 1,743 PLN. Organic channel growth occurred independently of this and is clear in absolute figures, but it does make the relative share metric look even better, which is worth stating transparently.
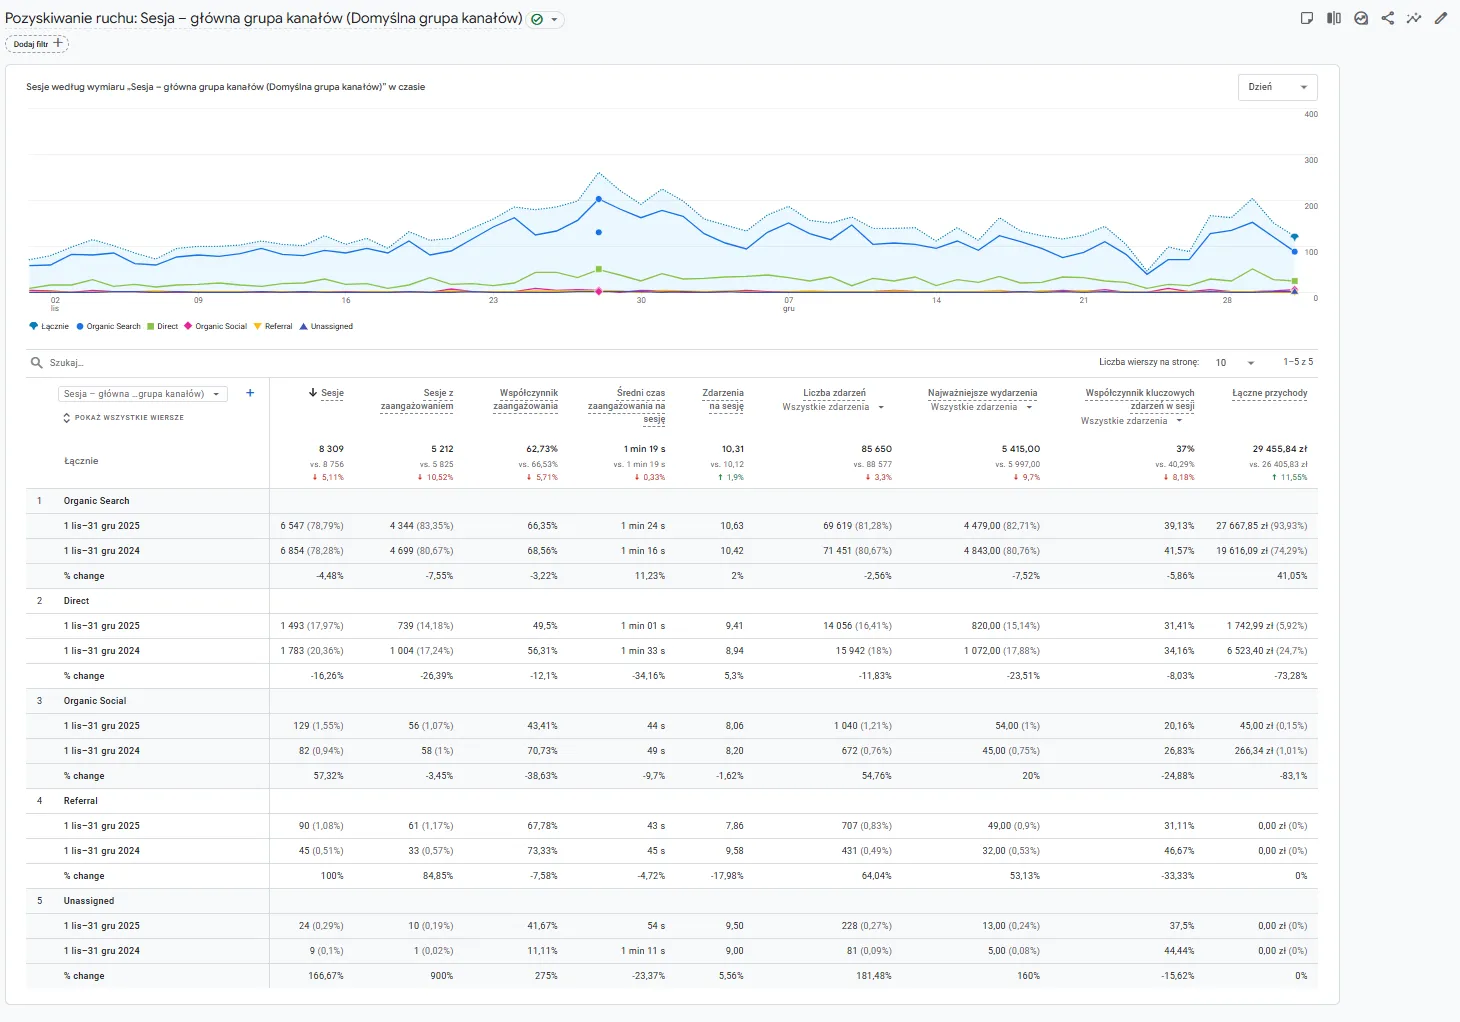
For the owner, this means one thing: rankings on Google are practically the sole revenue source here. A drop in visibility in September would not have meant a slower quarter. It would have meant having no season at all.
Where These Numbers Come From
Revenue and orders: Google Analytics 4, Organic Search channel. Clicks and average position: Google Search Console. Raw data, without adjustments or modeling.
We compare November and December 2025 to November and December 2024 - peak season to peak season. For a store with such heavy seasonality, this is the only comparison that answers how much the client earned from search at their peak moment.
What This Means if You Run a Seasonal Store
The season is won off-season. Doing work during the dead period looks like throwing money away because nothing in the metrics is growing. Growth only happens when it counts.
Fewer clicks can be a better result. If an agency only reports traffic growth, ask for sales from that traffic. These are two different numbers, and they can easily move in opposite directions.
Check what percentage of your sales comes from search. If it is 70% or more, SEO is not a supporting channel for you. It is the foundation your business rests on - and you had better realize that before the season begins, not while it is underway.
TL;DR - Summary in a Nutshell
- Client: a seasonal store with a winter and summer offering, no Google Ads campaigns, sales concentrated between November and March.
- Traffic: at the peak of the 2025 season, Google clicks were down 10% compared to the previous year.
- Sales: search engine revenue during the same window increased by 41%, and the number of orders grew by 36%.
- Context: the entire store grew by 12%, meaning the organic channel grew more than three times faster.
- Channel share: search accounts for 94% of seasonal sales, up from 74% the previous year.
- Source of growth: the number of orders, not higher prices. The average order value remained unchanged.
- Basis of the result: a holistic analysis of seasonal categories, mapping keywords to pages based on purchase intent, and implementing content several months before the sales peak.
Do You Run a Store with a Strong Seasonality?
The best time to check if you are ready for the season is four months before its peak. After that, all that is left is counting how much you managed to get done in time.